Lane Risk Insights
Welcome to LYNX Logix. This article will cover Lane Risk Assessment. By default for all users who log into LYNX Logix, the home page will be on the Lane Risk Assessment list of lanes which have been onboarded into the Risk Engine.


As a reminder, for a lane to be onboarded a minimum of five (5) tracked shipments with quality IoT data must be completed. This applies to available routes and legs.
A user is able to click any available row on the Lane list, which will navigate the user to the full details of the Lane Risk Assessment.


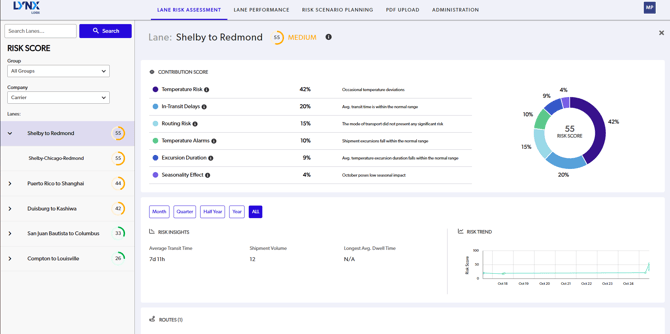
As you can see the following factors contribute to the Risk Score:
-
Temperature - Derived from historical data, a temperature profile is created for each lane, identifying the range within which over 90% of data points lie. This range helps classify readings as outliers (higher risk) or inliers (lower risk). Increasing readings near thresholds may indicate potential temperature excursions, packaging failures, or adverse events, which this metric aims to account for.
-
In-Transit Delays - Calculated by comparing current shipment punctuality against historical stop dwell times and in-transit leg durations, segmented by lane, route, and waypoint. Elevated risk indicates subpar on-time performance, impacting the 'On-Time' component of 'OTIF'. This metric is crucial for optimizing operational planning and identifying potential areas for procedural review in case of increasing delays.
-
Routing - Determined from device data points, each assigned a waypoint with a fixed transport mode (road/air/sea). Historical data reveals the mode with the most delays and temperature deviations, typically ground being highest risk and air lowest. This metric is significant due to the inherent uncertainties of ground transport (more touch-points, poorer package handling) versus air transport (fewer touch-points, better package handling).
-
Temperature Alarms - Calculated as the total number of excursions versus the historical average for a specific leg/route/lane. A higher count indicates potential systematic issues in the respective lane/route/leg requiring attention.
-
Excursion Duration - Derived by comparing the duration and severity of temperature deviations from the expected range against the historical average for a specific leg/route/lane. Increased duration indicates ineffective remediation of excursions, necessitating further action to prevent prolonged deviations, potentially impacting the RSB.
-
Seasonality - Determined during lane onboarding by analyzing historical data to identify periods with a higher likelihood of excursions. The signal is stronger with multi-year data. Typically, summer months pose a higher risk due to improper cooling. This metric captures long-term, systematic issues in a lane's temperature data and punctuality.

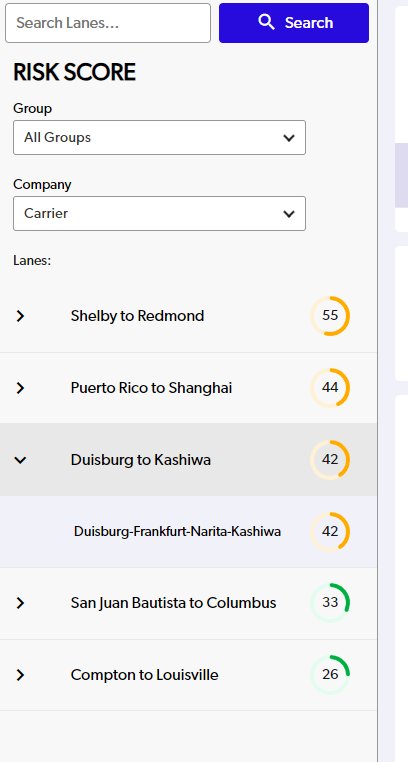
On the left pane is also the available onboarded lane list with risk sorted from highest to lowest. Users can click through lanes, clicking on a specific lane will unveil the route(s) available view the assessment for that specific Lane.
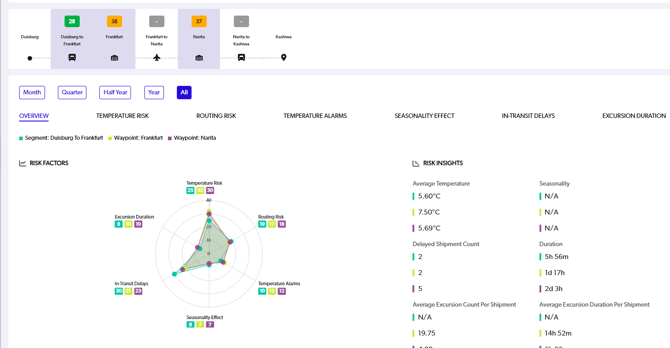
Clicking on a route will display the full details about the lane including the Risk Score, Waypoints, Segments, Shipment count, and average transit time of the lane.
Users can compare risk across the various legs by clicking on the specific legs. The overview spider graph will update according.


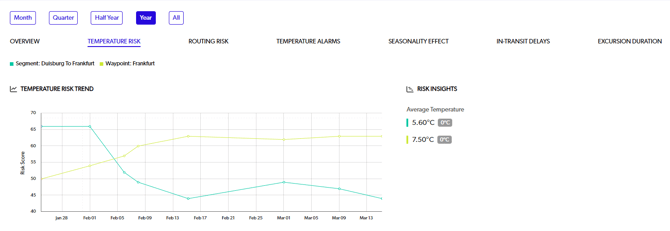
User can additionally assess the risk over time and view the Risk Factor Trend data by selecting time and factor.


